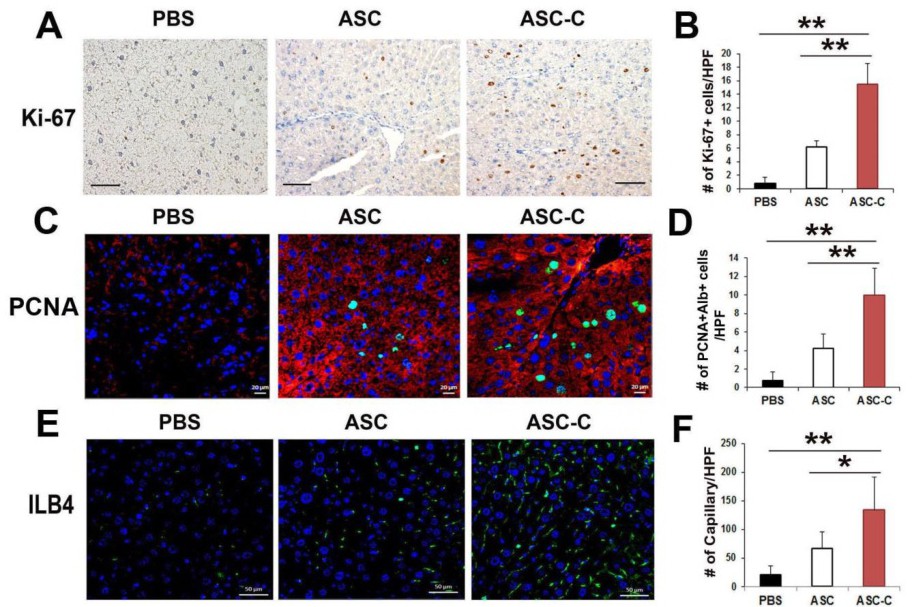
Fig. 10. ASC-C promote liver regeneration. (A) Representative images of Ki-67-positive cells in liver tissues by immunohistochemistry. The brown colored nuclei (arrow) indicate the Ki-67-positive hepatocytes. Bar = 100 µm. (B) Quantitative analysis of Ki-67 staining. **p<0.01; n = 7 per group. HPF = high power field. (C) Representative images of PCNA (green) and anti-mouse albumin (red)-positive hepatocytes in liver tissues by immunohistochemistry. Bar = 20 µm. (D) Quantitative analysis of PCNA staining. **p<0.01; n = 7 per group. (E) Representative images of capillary density in liver tissues after cell injection. Immunohistochemistry was performed by staining for IL-B4, an endothelial marker. Bar = 20 µm. (F) Quantitative analysis of the number of capillaries. **p<0.01; n = 7 per group.